FAQ
Frequently asked questions
What data does AeroScope use?
Aircraft positions broadcast on 1090 MHz (ADS-B), republished by volunteer receiver networks such as adsb.fi, adsb.lol, airplanes.live and OpenSky, plus a satellite-ADS-B merge. AeroScope fuses 60+ such feeds and de-duplicates them by ICAO 24-bit address.
Does AeroScope use AI, deep learning or reinforcement learning?
No deep learning and no reinforcement learning. The anomaly layer is deliberately torch-free and built on established libraries — River, scikit-learn IsolationForest, pykalman, OpenAP, stumpy and PyOD — with consensus voting (at least two detectors must agree). An earlier RL prototype was evaluated and retired in favour of this transparent, reproducible stack.
How does it detect a spoofed or fake aircraft?
Spoofed ADS-B tends to contradict either physics or its own integrity metadata. AeroScope runs a DO-260B-style integrity check (NIC/NACp/NACv/SIL), a Kalman normalised-innovation test on the trajectory, and self-consistency residuals — geometric-versus-barometric altitude, ground-speed-versus-Mach, and track-versus-heading. Messages that fail these are flagged for a second look.
Is the data real-time?
Yes. A lightweight loop refreshes positions roughly every seven seconds and the client dead-reckons each aircraft between fixes for continuous motion, while a heavier enrichment-and-detection pipeline runs on its own cadence so analysis never blocks the map.
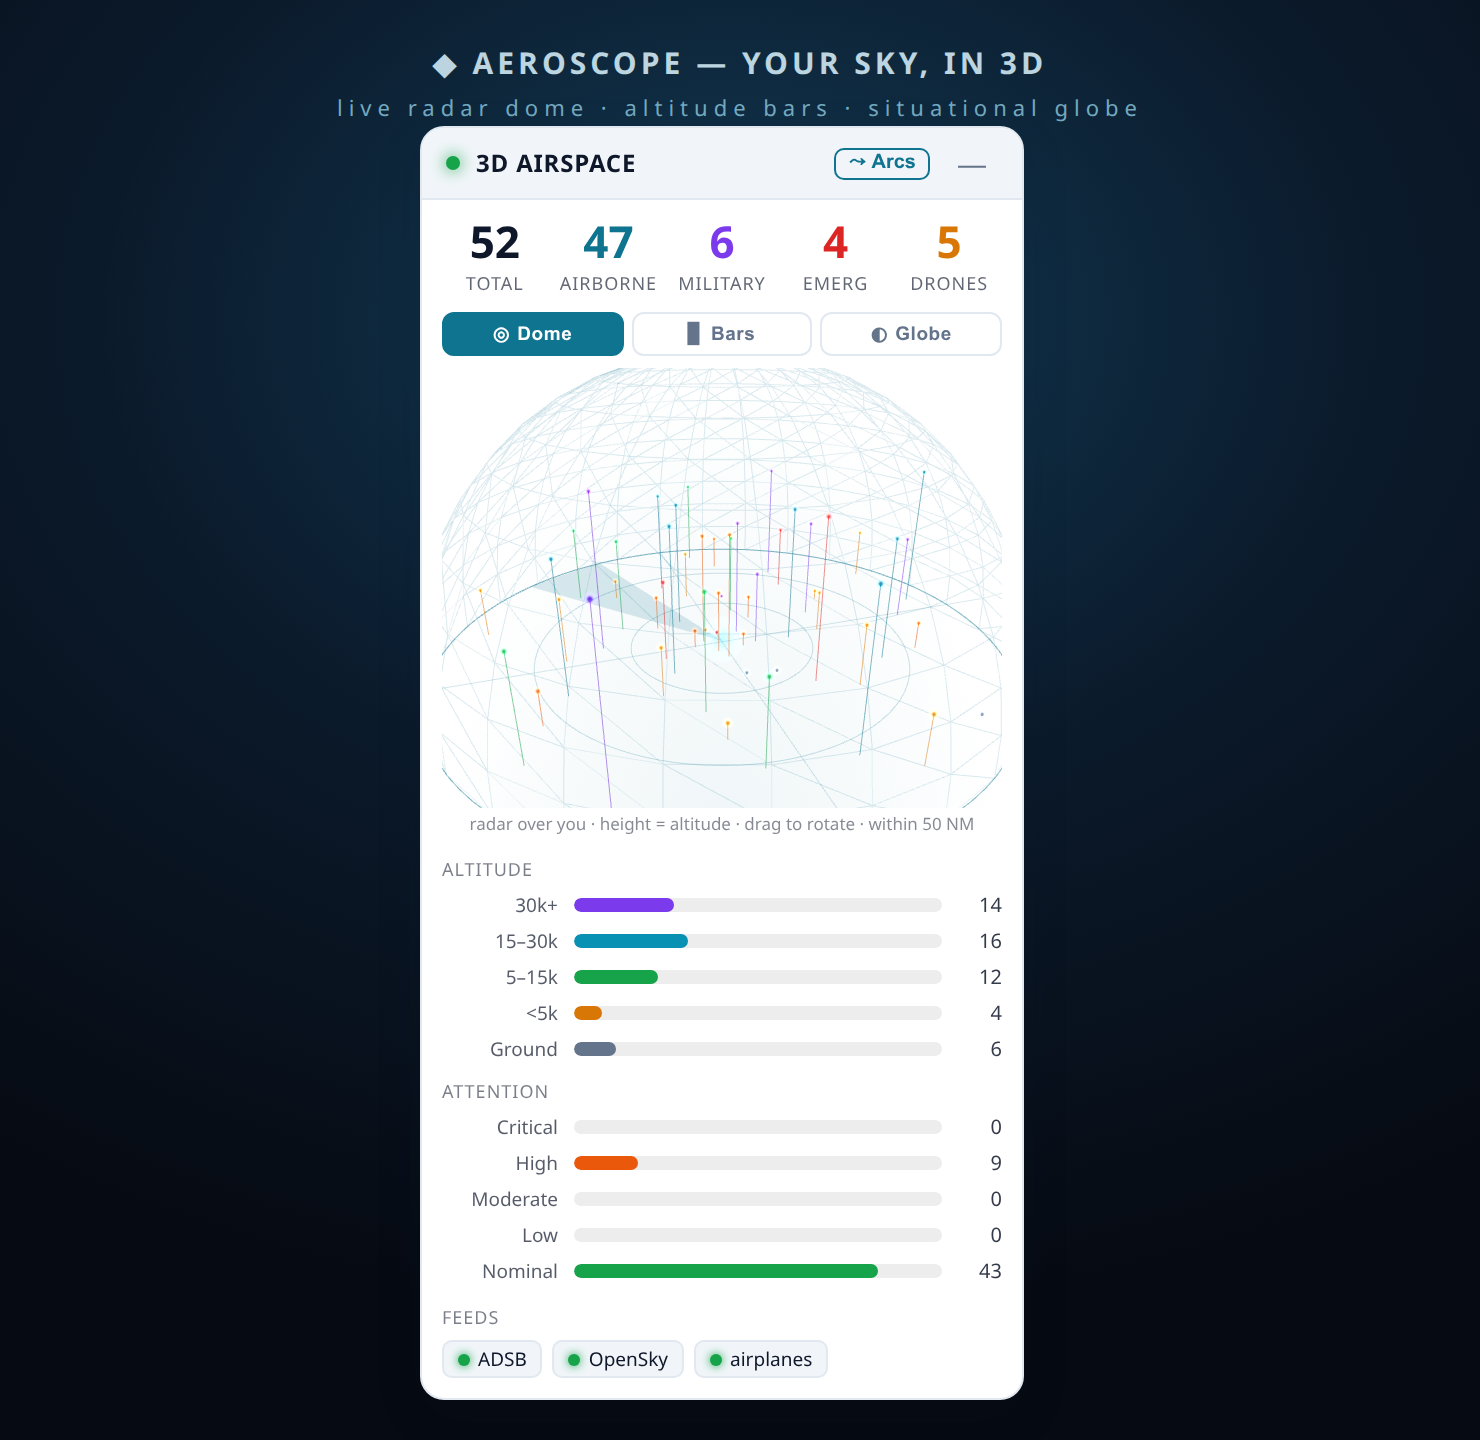
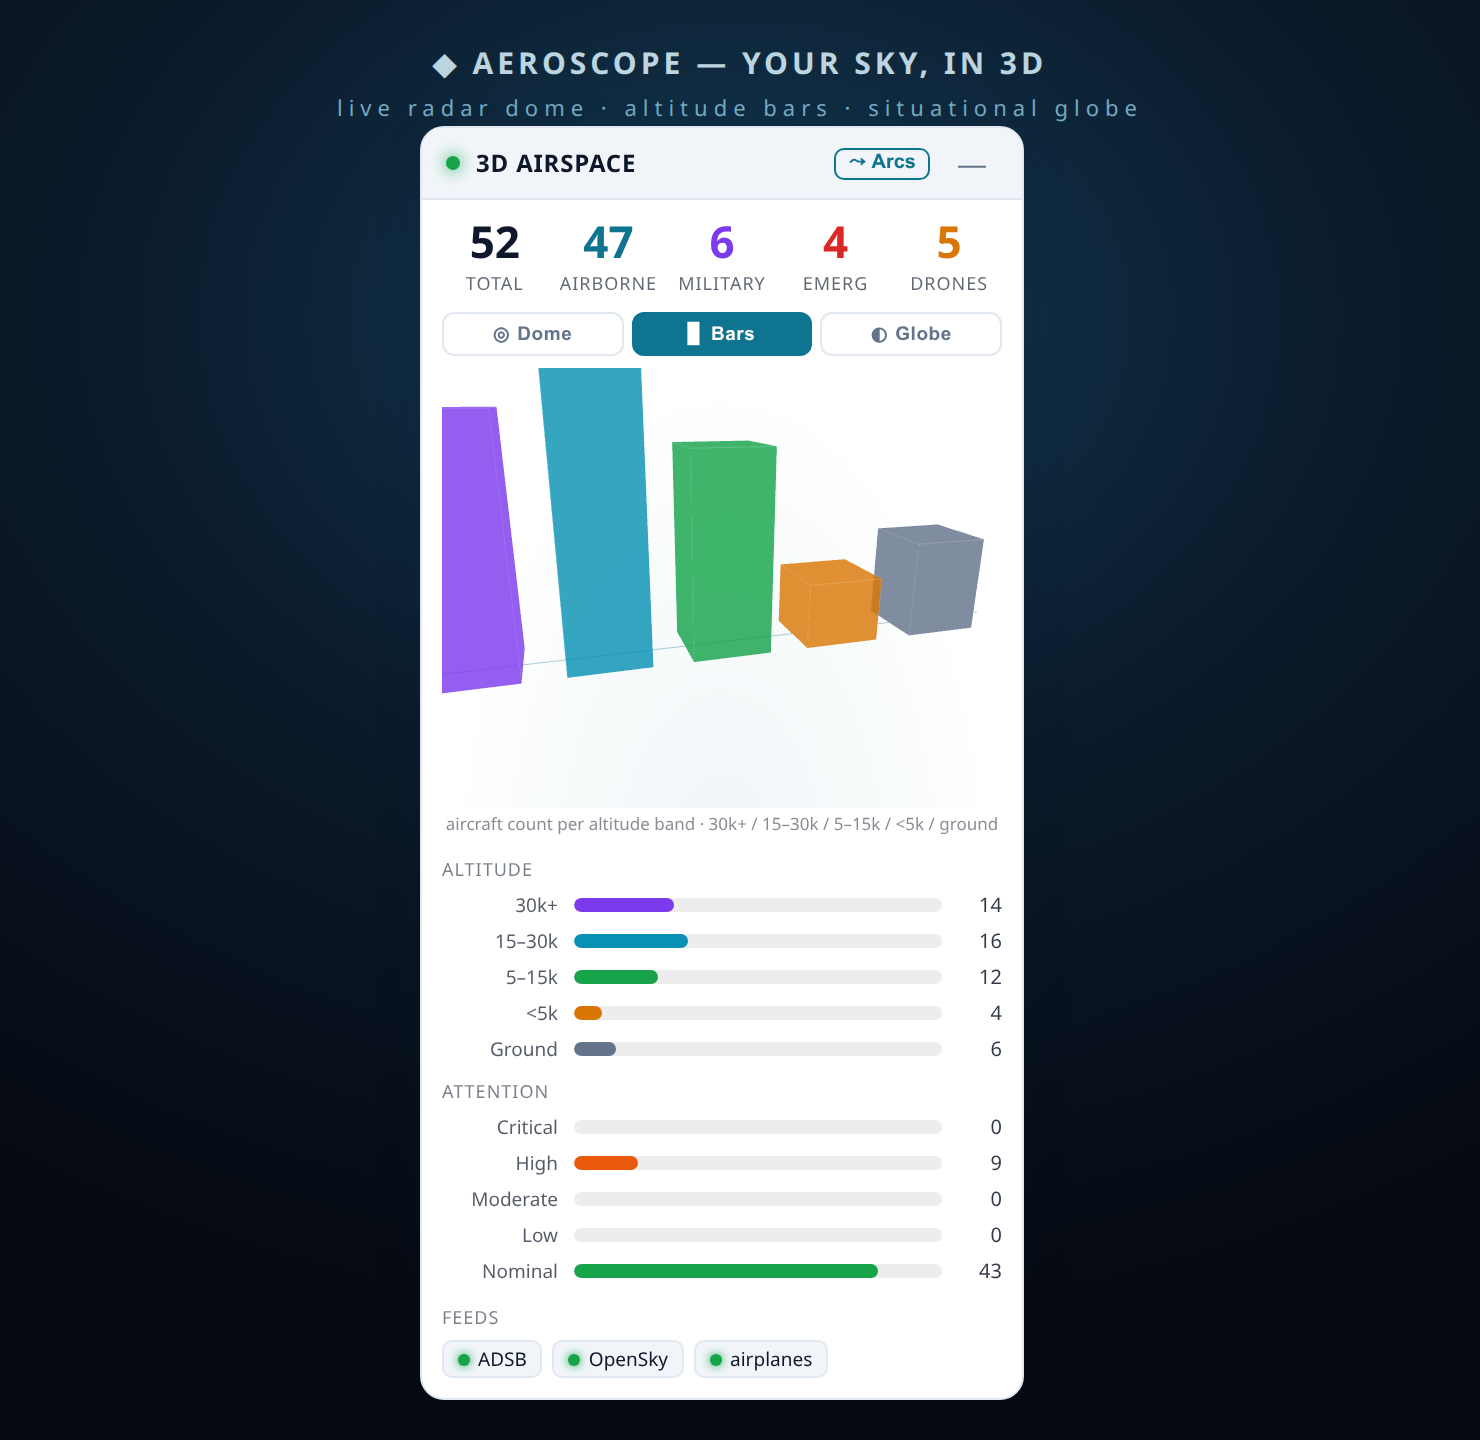
Can I see what is flying over my house right now?
Yes — set your location and AeroScope shows the live traffic overhead with distance, bearing, identity and an attention score for each aircraft.
Open the live map to try it.